• Congratulations to John K. Jordan winner of the June 2025 Turning Challenge (click here for details)
  • Congratulations to John Shannon"Cherry Bowl" being selected as Turning of the Week for June 30 2025 (click here for details)
  • Welcome new registering member. Your username must be your real First and Last name (for example: John Doe). "Screen names" and "handles" are not allowed and your registration will be deleted if you don't use your real name. Also, do not use all caps nor all lower case.

Where the members and chapters are

hockenbery

Forum MVP
Beta Tester
TOTW Team
Joined
Apr 27, 2004
Messages
9,227
Likes
5,869
Location
Lakeland, Florida
Website
www.hockenberywoodturning.com
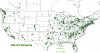
I have learned a tiny bit of GIS mapping and have produced displays of AAW information. Below are Five screen captures of the interactive map displays.

These are left to right
Membership - 3 sizes of dots represent 1-3, 4-9, an 10-26 members
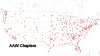
Chapter - meeting city for the chapters
AAW symposium - location and year of all past and scheduled AAW symposiums
Membership distribution - membership in regions each having 20% of the US members
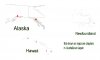
Additional North American chapters that did not fit on the chapter map (not shown are chapters in Japan and Australia)

Also GOOGLE EARTH users may download a KMZ file with members, chapte, and sympsoium locations from:
http://maps.hockenbery.net/AAW.htm

Here is a fun fact: The District of Columbia has the densest population of woodturners in the US.

Enjoy,
Al
 

Attachments

  • 2009Membership.jpg
    2009Membership.jpg
    178 KB · Views: 55
  • usChapters.jpg
    usChapters.jpg
    97.6 KB · Views: 110
  • AAW Symposiums.jpg
    AAW Symposiums.jpg
    63.6 KB · Views: 48
  • popdistribution.jpg
    popdistribution.jpg
    195.6 KB · Views: 56
  • other.jpg
    other.jpg
    265.5 KB · Views: 17
Last edited:
I understand why Alaska, Hawaii, and Newfoundland "did not fit on the chapter map," but what about Australia and Japan?

ref: Resource Directory, p. 34.

Best regards,
Joe
 
Al,

I've been out of real software development for about 20 years, and I've had to limit the number of interests I (try to) maintain, to reduce crashing and burning; although GIS is tempting.

Depending on the data format requirements, you might be able to construct boundary and point data from a good ol' World Atlas (paper), or something like Terraserver, reporting latitude and longitude. For the purpose at hand, the outlines could be crude without losing value. If the data are encoded (vs. literal), you're on your own. My most recent exercises were bare-metal editing of bmp files - kinda tedious.

OTOH, graphical output, if usable for "data entry", could be accurately built in CAD, too; basically hand-drawn with screen shot (Use PrintScreen to send to clipboard, and import to whatever).

Joe
 
Joe,
I also am quite far from my technical roots.

The whole fun of the GIS is that I can use stuff my Government makes available through the census and USGS web sites.
the map outlines are mostly North Amerca.
-Al
 
Cool stuff Al.
I guess you are using zip codes to generate your plots.
I didn't 'get' the 20% regions. The North West/west region seemed kind of odd.
It sort of looks like it could have been a north south axis just as much as an East West.
GIS systems are way cool tools.
I used to create the data and boundary data sets by hand and then batch submit them.
Much nicer and easier now.

Mark.
 
Mark,

The 20% regions are areas that have 20% of the members in them.
It gives a sense of the density of membership. The small north east has as many members as the large northwest.

I just found longitudes that the members east to west into 40%,20%,40%
then divided the east and west regions with a latitudes that produced 5 regions.
There are other ways to divide up the members I'm not sure it is real useful.
basically members live where people live.

I use the zip code locations from the Census bureau files.

-Al
 
Back
Top